
Leadership
| Jonathan E. Koteen, President |
| Virgil S. Smith, Vice President |
| Aaron Brown, Council Member |
| Christobal E. Illingworth, Council Member |
| Faron M. Owl, Council Member |
| Jeannette Peterson, Council Member |
| Zion C. White, Council Member |
(updated October 2025)
Contact Information
Address: PO Box 1899 Yuma, Arizona 85366-1899
Phone: 760-919-3600
Community Health Director:
Sosa Nita Diaz s.diaz@quechantribe.com
Higher Education Director:
Ora Lee Durand-Valisto o.durand@quechantribe.com
Historic Preservation Officer:
H. Jill McCormick historicpreservation@quechantribe.com
GOVERNANCE: The Fort Yuma-Quechan Tribe is governed by a President, Vice President, and five council members. Council members serve two-year terms. The President, Vice President, Secretary, and Treasurer are selected by the Council. The Council meets on the first Tuesday of each month. The Tribe resides in Congressional Districts 3 and 4; Legislative Districts 4 and 13.
CONSTITUTION:
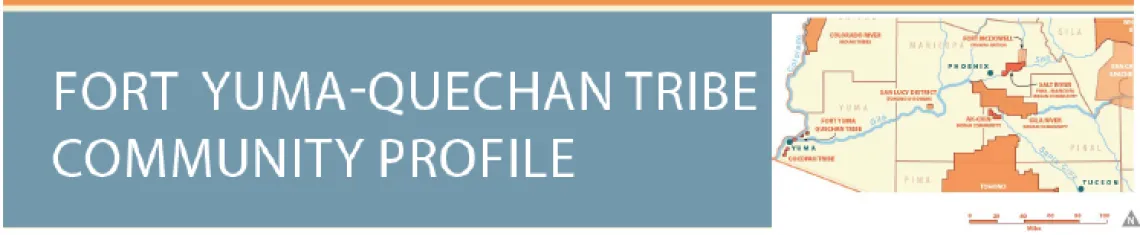
COMMUNITY PROFILE: Previously known as the Yuma Indians, the Quechan Tribe of the Fort Yuma Reservation have always lived in the Colorado River Valley. Their land borders California and Mexico, and the Reservation was established in 1884. Quechan (pronounced "kwuh-tsan") means "those who descended." Their distinct language, the native tongue of southeastern California and southwestern Arizona, is believed to be spoken by just a few hundred people.
Their location along the Colorado River has meant a long history of trading and exchange networks with other tribes, as well as battles over land. According to the 2018-2022 Census, 1,536 Quechan live on the Fort Yuma Indian Reservation.
The Fort Yuma-Quechan Tribe operates the Paradise Casino in Yuma, Arizona. The Tribe also operates a sand and gravel enterprise, five trailer and RV parks, a grocery store, and a museum. The Tribe's 700-acre farm is leased to non-tribal members.
According to the U.S. Census Bureau 2018-2022 American Community Survey, the population on the Fort Yuma Indian Reservation is 1,536. The following document provides a Census snapshot of the Fort Yuma-Quechan Tribe with comparisons to the state of Arizona and the United States as a whole.
Note: When interpreting data for small populations or rural areas, it is important to note the margin of error which is provided where possible. The margin of error can be interpreted as providing a 90 percent probability that the true value lies within the estimate plus and minus the margin of error.
First Things First is Arizona's early childhood agency, providing health screenings and a variety of services across the state. Included here are two of their reports for the Yuma region, which includes the Arizona portion of the Fort Yuma-Quechan reservation:
The following reports summarize the businesses and market predictions available on the Fort Mojave Indian Reservation: